2. Key Concepts
- Malnutrition
- Undernutrition
- Stunting
- Wasting
- Food Insecurity
- Global Hunger Index
- Macronutrients
- Micronutrients
- Micronutrient-related malnutrition
- Hidden hunger
- Anemia
- Vitamin A deficiency
- Iodine deficiency
- Universal salt iodization
- Overweight
- Obesity
- Food environment
- Food desert
- Food swamp
- Triple burden of malnutrition
- Commercial Determinants of Health
3. Prelim Engagement
1. Let's start our discussion of Nutrition in a Global Context by having a brief overview of the state of food security in the world and how the COVID-19 pandemic is detracting us even more from the Sustainable Development Goal 2 of ending hunger.
2. As we listen to this short podcast, let’s think about the connection between the social determinants of health that we have been studying throughout this course and the influence those determinants might have on access to nutrition. How are individuals’ and households’ day to day activities influenced and affected by a lack of resources to meet their basic nutritional needs?
Are there differences in the availability and affordability of fruits and vegetables according to the level of income of different countries? Is this important to consider when we are developing strategies to address the nutrition needs of populations?
Lancet Global Health Podcast: Fruit & Veg Consumption in Low, Middle and High Income Countries
Nutrition is a very important topic that is interconnected with many other dimensions of well-being. Nutrition status has a profound relationship with physical and intellectual health, as well as development through all stages of life. Good nutrition is essential to improve the well-being of women and children, to support the building of a stronger immune system of older adults, and to lower the risk in all populations of developing diseases such as diabetes and cardiovascular disease.

The following section adapted from (Roser and Ritchie, 2019) and (WHO, 2021) as cited.
Having a diet which is both sufficient in terms of energy (caloric) requirements and diverse to meet additional nutritional needs is essential for good health.
Malnutrition refers to deficiencies [not enough], excesses [too much], or imbalances in a person’s intake of energy and/or nutrients.
(WHO, 2021)
As the definition above demonstrates, malnutrition does not only refer to not enough food; it also refers to consuming too much food or an imbalance of the kind of foods an individual consumes.
Malnutrition refers to 3 broad groups of conditions:
- Undernutrition: Including wasting (low weight-for-height), stunting (low height-for-age) and underweight (low weight-for-age) — we will look at these terms in more detail later in this section.
- Micronutrient-related malnutrition: Including micronutrient deficiencies (lack of important vironments and minerals) or micronutrient excess
- Overweight, obesity — also referred to as overnourishment — and diet-related noncommunicable diseases such as diabetes and heart disease
Source: WHO, 2021
In the sections to follow, we will explore undernutrition, micronutrient-related malnutrition and overweight, obesity and diet-related noncommunicable diseases in more detail.
Undernourishment
Undernourishment, especially in children and mothers, is a leading risk factor for death and other health consequences globally.
The UN has set a global target as part of the Sustainable Development Goals to “end hunger by 2030“. Currently we are far from reaching this target.
- As many as 811 million people worldwide go to bed hungry each night
- An estimated 14 million children under the age of five worldwide suffer from severe acute malnutrition (wasting), yet only 25 percent of acutely malnourished children have access to lifesaving treatment
- Small farmers, herders, and fishermen produce about 70 percent of the global food supply, yet they are especially vulnerable to food insecurity as poverty and hunger are most acute among rural populations
- Conflict is a cause and consequence of hunger. In 2020, conflict was the primary driver of hunger for 99.1 million people in 23 countries

However, there is more than enough food produced in the world to feed everyone on the planet. So why are so many people suffering from hunger? Think about the determinants of health.
What share of people are undernourished?
The prevalence of undernourishment, as a share of the population, is the main hunger indicator used by the UN’s Food and Agriculture Organization.
It measures the share of the population which has a caloric (dietary energy) intake which is insufficient to meet the minimum energy requirements defined as necessary for a given population.
The global map of the prevalence of undernourishment – as a percentage of the total population – is shown from 2000 onwards. Countries with a prevalence below 2.5% are not shown.
How is undernourishment distributed globally?
The visualization below shows the prevalence of undernourishment by world region.
Here we see that overall, and across most regions the prevalence of hunger has fallen since the millennium. Globally this has fallen from 13.4 percent in 2000 to 8.8 percent in 2017.
This increase in hunger levels is largely a result of increases in Sub-Saharan Africa (where rates have risen by several percentage points in recent years) and small increases in the Middle East & North Africa.
How many people are undernourished globally?
The chart below shows the total number of individuals across the world who are defined as undernourished.
Globally we see a falling – although variable – trend over the last few decades. The total number of undernourished has been steadily falling. However, over the last few years, the total number increased to around 663 million in 2017.
The UN FAO have linked this increase in undernourishment in particular to the rising extent of conflict-affected countries (which is often a leading cause of famine), and compounded by climate-related factors such as the El Niño phenomenon (which can inflict both drought and flood conditions).3,4
What is the depth of the food deficit globally?
The prevalence of undernourishment provides the core indicator of hunger with FAO metrics. However, this measure does not give an indication of the average severity of undernourished; it tells us how many lie below the minimum energy requirements, but not how far they lie below this line.
To provide an estimate of the intensity of undernourishment in a population, the FAO used a metric called the ‘depth of the food deficit’.
The depth of the food deficit measure provides an estimate of the number of calories the average individual would need in order to balance their caloric intake with energy requirements.
Calculating the depth of the food deficit
The depth of the food deficit is calculated by measuring the difference between the average energy requirement and average caloric consumption of the undernourished population, multiplying this food deficit by the number of undernourished individuals (to give a value of the total caloric deficit of the country), and then dividing by the total population. The average intensity of the food deficit is measured in kilocalories per person per day.
Below the depth of the food deficit is mapped out based on FAO data from 1992 onwards. In 2016, we see that the majority of developing countries have a food deficit below 200 kilocalories per person per day. A small selection of countries had a deficit ranging from 300-500, most in Sub-Saharan Africa. The country with the highest deficit was Haiti, at 530 kilocalories per person per day.
You can view trends of any country over time by selecting it from the map.
Childhood undernutrition
There are three key physiological measures of undernourishment and undernutrition in children. The measures discussed and visualised in the sub-sections below are:
Stunting – being ‘too short for one’s age’;
Wasting – being ‘dangerously thin for one’s height’; and
Underweight – low weight-for-age in children.
Too little height-for-age: Stunting
Children who are stunted are determined as having a height which falls below the median height-for-age of the World Health Organization’s Child Growth Standards.
Stunting can be caused by a range of compounding factors including:
- nutritional intake of the child
- nutritional intake of the mother during pregnancy
- the recurrence of infectious diseases and
- infections from poor hygiene practices.
Stunting is an indicator of severe malnutrition. This means it is an extended, or chronic, experience of not getting enough food and/or not getting the right kind of food.
Unlike wasting and low weight-for-age, the impacts of stunting on child development are considered to be largely irreversible beyond the first 1,000 days of a child’s life. To emphasize again — the impacts of stunting are largely irreversible after the first 1,000 days of a child’s life. Stunting can have severe impacts on both cognitive and physical development throughout an individual’s life. Therefore, ensuring babies have the nutrition they need — and that their mothers’ need — in the earliest years of their lives is extremely important for their health and development later on.

The global map of the prevalence of childhood stunting is shown as the share of the under-5 population who are defined as stunted.
Note that because of data collection patterns, this data is often not available on an annual basis in most countries. The year of the latest published estimates vary by country so you may have to use the time scrollbar to find the most up-to-date figure for a given country.
Too little weight-for-height: Wasting
Wasting is defined as being dangerously thin for one’s height, and is generally a sign (especially in children) of rapid weight loss.
Wasting is often a sign of getting very little nutritious food over a short period of time. We often see wasting in children especially during times of sudden famine or in humanitarian emergencies or natural disasters when populations need to flee their homes and do not have access to nutritious food suddenly.
A child is classified as wasted if his or her weight-for-height is more than two standard deviations below the median for the international reference population ages 0-59 months. The factors which contribute to this weight loss are associated with measures related to both diet and nutrition, and infection. As a result, wasting is often compounded by conditions of:
- poor nutrition,
- feeding practices and
- inadequate sanitary conditions.6
Unlike stunting, wasting can be treated through improved nutritional intakes, healthcare interventions and treatment of infection. Therefore, if treated quickly and appropriately, wasting is a reversible condition.
The global map of the prevalence of childhood wasting is shown as the share of the under-5 population.
In 2015, South Sudan experienced the highest prevalence of wasting, with 22.7 percent of under-5s defined as wasted. The prevalence of wasting is typically highest across Sub-Saharan Africa and South Asia, with countries such as India, Sri Lanka, Djibouti, Sudan and Niger recording some of the highest levels (greater than 15 percent).
The share of children suffering from wasting has been declining. If we compare our global map in the early 2000s to a decade later, we see the number of countries with a prevalence greater than 15 percent has fallen. However, the nature of wasting- exemplified often by rapid weight loss- means that particular short-term events which impact food supplies can disrupt long-term trends. This is particularly prevalent in countries with poor political stability; for example, we see a large spike in childhood wasting in the Democratic Republic of Congo during the late 1990s-early 2000s during the Second Congo War.
Underweight children
Undernourishment, or the incidence of being underweight for age, can include children who are stunted, wasted or suffering from insufficient energy intake over a longer period of time.
In the chart we see the share of children under-5 who are defined as underweight for their age across world regions since 1990. Overall, we see a steady decline at the global level, falling from around 25 percent in 1990 to 15 percent in 2015.
South Asia- despite having the highest regional prevalence- has made significant progress over the last few decades, reducing undernourishment by 20 percentage points from 1990-2017. The rate of undernourishment in Sub-Saharan Africa has also fallen notably, from 30 percent in 1990 to below 20 percent in 2017. Rates in East Asia, Latin America, North Africa and the Middle East are notably lower than South Asia and Sub-Saharan Africa, but have also seen significant declines, each more than halving the prevalence of undernourishment since 1990.
The Global Hunger Index (GHI)
As we have explored above, there are a number of indicators by which we can measure and track progress related to malnutrition. In order to effectively capture and track progress on hunger within a single metric, the International Food Policy Research Institute (IFPRI) have defined a score system termed the ‘Global Hunger Index‘ (GHI).
The Global Hunger Index (GHI) attempts to assess the multidimensional nature of hunger, by combining four key indicators of malnutrition into a single index score.7
These four indicators are:
Undernourishment: the proportion of undernourished people as a percentage of the population (reflecting the share of the population with insufficient caloric intake);
Child wasting: the proportion of children under the age of five who suffer from wasting (low weight for their height, reflecting acute undernutrition);
Child stunting: the proportion of children under the age of five who suffer from stunting (low height for their age, reflecting chronic undernutrition); and
Child mortality: the mortality rate of children under the age of five (partially reflecting the fatal synergy of inadequate nutrition and unhealthy environments).
The index reflects scoring by country on a 100-point scale where 0 is the best score (no hunger) and 100 the worst. A score>=50 is defined as ‘extremely alarming’; 35-50 as ‘alarming’; 20-35 as ‘serious’; 10-20 as ‘moderate’ and <10 as ‘low’.
In the map we see the global map of GHI scores, with a time range of 1992, 2000, 2008 and 2016, 2017 and 2018.8
Geographically we see that GHI scores are highest (i.e. worst) across Sub-Saharan Africa and South Asia. In 2018, most countries in South Asia and Sub-Saharan Africa received a score within the ‘serious’ or ‘alarming’ category. Most countries across Latin America, East & Central Asia, and Eastern Europe had low hunger levels within the ‘low’ or ‘moderate’ categories.
However, if we track progress in GHI scores through time, we see definitive improvements across all regions. In 1992, most countries across Sub-Saharan Africa and South Asia scored within the ‘extremely alarming’ or ‘alarming’ classification. By 2018, only one country with available data (Central African Republic) remained within the top category of ‘extremely alarming’, and most have been downgraded to the ‘serious’ category. In other regions, countries have typically shifted from moderate-to-serious in 1992 down to low-to-moderate in recent years.
Long-term decline of undernourishment
What do we know about the decline of undernourishment in the developing world over the long run?
Although it would be vital for our understanding of global development we are lacking historical data on hunger and malnourishment.
To provide some sense of how malnutrition has changed over a longer timeframe, we have extended the latest data on undernourishment backwards with FAO estimates, using previous methodologies, for 1970 and 1980. This series that shows the prevalence of undernourishment (in %) in developing countries is shown in the chart. Data for 1970 and 1980 has been sourced from two FAO State of Food Insecurity in the World (SOFI) reports, for 2006 and 2010.
Estimates of the prevalence of undernourishment differ between these two reports. The 2006 report estimates a prevalence of 37 percent in 1970, reducing to 28 percent in 1980;10 the 2010 report instead estimates a reduction from 32.5 percent to 25 percent, respectively.11
This reflects a considerable uncertainty of these estimates and this aspect has to be taken into account as indicated in the subtitle of this chart.
Given the uncertainty in these earlier estimates, what can we say about how undernourishment has changed through time? Whilst specific figures for the level of undernourishment differ between sources, they do agree on the direction of change.
Both sources report a consistent downward trend, with similar rates of reduction. The share of undernourished people in the developing world has been declining over this longer timeframe, but there are no confident figures on how many people were undernourished at each point in time.
Food Insecurity
Food insecurity is defined by the UN FAO as the “situation when people lack secure access to sufficient amounts of safe and nutritious food for normal growth and development and an active and healthy life.”17
Food insecurity can be caused by a number of factors, including:
- the unavailability of food
- unaffordable food, and
- unequal distribution of food between household members.
Food insecurity is one of the major causes of poor nutrition.
Food insecurity can be based on inadequate quality or quantity of food. There are different levels of food insecurity:
- Moderate food insecurity
- Severe food insecurity
Moderate food insecurity is generally associated with the inability to regularly eat healthy, nutritious diets. High prevalence of moderate food insecurity is therefore an important indicator of poor dietary quality, and the development of health outcomes such as micronutrient deficiencies.
Severe food insecurity is more strongly related to insufficient quantity of food (energy) and therefore strongly related to undernourishment or hunger.
Severe food insecurity
What share of people are severely food insecure?
In the chart we see the share of the total population defined as suffering from severe food insecurity (i.e. insufficient quantity of food).
In 2018, 9.2% of the world population were defined as severely food insecure. As a share of the population, food insecurity is highest in Sub-Saharan Africa where nearly one-third are defined as severely insecure.
How many people are severely food insecure globally?
In the charts we see the total number of people defined as severely food insecure.
Globally, around 697 million were severely food insecure in 2018.
More than half of those living with severe food insecurity were in Asia; nearly 40% were in Africa. The remaining 10% were split between the Americas, Europe and Oceania.
Micronutrient-related malnutrition
The following section adapted from Ritchie and Roser, 2017 and WHO, 2021b as cited
In contrast to macronutrients (energy, protein and fat), micronutrients are vitamins and minerals which are consumed in small quantities, but are nonetheless essential for physical and mental development (Ritchie and Roser, 2017).
Inadequacies in intake of vitamins and minerals often referred to as micronutrients, can also be grouped together. Micronutrients enable the body to produce enzymes, hormones, and other substances that are essential for proper growth and development.
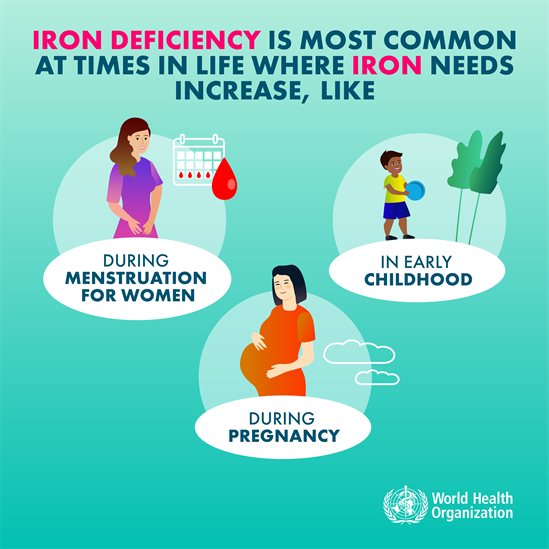
Iodine, vitamin A, and iron are the most important in global public health terms; their deficiency represents a major threat to the health and development of populations worldwide, particularly children and pregnant women in low-income countries (WHO, 2021b). Other essential micronutrients you might hear about often in Global Health include (but are not limited to): zinc, calcium, B-vitamins, and vitamin C.
Kwashiorkor is a severe form of malnutrition. It’s most common in regions where babies and children do not get enough protein or other essential nutrients in their diet.
The main sign of kwashiorkor is too much fluid in the body’s tissues, which causes swelling under the skin (oedema). It usually begins in the legs, but can involve the whole body, including the face.
Symptoms of kwashiorkor
As well as oedema, symptoms of kwashiorkor can include:
- loss of muscle mass
- an enlarged tummy (“pot belly”)
- regular infections, or more serious or long-lasting infections
- red, inflamed patches of skin that darken and peel or split open
- dry, brittle hair that falls out easily and may lose its colour
- failure to grow in height
- tiredness or irritability
- ridged or cracked nails
Kwashiorkor can be fatal if it’s left untreated for too long because children become very vulnerable to infections.
What causes kwashiorkor?
The main cause of kwashiorkor is not eating enough protein or other essential vitamins and minerals. It is most prevalent in low- and middle-income countries.
Kwashiorkor is rare in high income countries, but it can occasionally happen as a result of severe neglect, long-term illness, a lack of knowledge about good nutrition, or a very restricted diet.
Although kwashiorkor can affect people of all ages, it’s more common in children than adults (NHS, 2019).
Micronutrient deficiencies form an important global health issue, with malnutrition affecting key development outcomes including poor physical and mental development in children, vulnerability or exacerbation of disease, mental retardation, blindness and general losses in productivity and potential. Unlike energy-protein undernourishment, the health impacts of micronutrient deficiency are not always acutely visible; it is therefore sometimes termed ‘hidden hunger’ (the two terms can be used interchangeably).
Hidden hunger refers to micronutrient deficiencies, a type of undernutrition which is not always visible like stunting or wasting are visible, but can have serious, sometimes irreversible, life-long health consequences for individuals throughout their lifetime if not treated early on.
The World Health Organization (WHO) estimates that more than two billion people suffer from micronutrient deficiency — or hidden hunger — globally.
Who is most vulnerable to micronutrient deficiency?
Although any individual can experience micronutrient deficiency, pregnant women and children are at greatest risk of developing deficiencies. This is not only as a result of low dietary intake, but also from higher physiological requirements; pregnancy and childhood development often increases demand for specific vitamins and minerals.
The nutritional status of pregnant women is not only relevant for her own health, but can also have important consequences for the development of her child. Monitoring and addressing micronutrient deficiencies in both pregnant women and early childhood years is therefore essential for optimal development and health within a given population.
Data on deficiency prevalence, impacts and intervention strategies are therefore gathered most frequently for these specific demographics. Much of the content which follows is therefore focused on (but not limited to) malnutrition in pregnant women and children under the age of five.
Micronutrient deficiency priorities in Global Health
In this section we will explore in more detail some of the highest priorities in Global Health when it comes to micronutrient deficiencies.
While there are a number of micronutrient deficiencies prioritized by Global Health actors, we will explore here anemia (iron and/or vitamin B12 deficiency), vitamin A deficiency and iodine deficiency.
To read about other micronutrient deficiency priorities globally, such as zinc, you can click here.
Anemia
Anemia is a condition whereby an individual’s blood lacks enough red blood cells (RBCs) to carry oxygen efficiently around the body. Anemia can result from a lack of iron or vitamin B12, although iron deficiency is the most common type.
Globally, anemia affects more people than any other health problem. Anemia has important implications for general productivity and development, reducing the work capacity of individuals by up to 20 percent. In more serious cases, anemia can lead to exacerbation of disease and illness.
The World Health Organization estimate that 20 percent of maternal deaths are attributed to anemia alone.1
In the chart below we see the prevalence of anemia in pregnant women. Globally, around 40% of pregnant women are anemic. Think back to our discussion of women’s and maternal health sitting at the intersection of both biological and social determinants of health — the high prevalence of anemia in pregnant women is an excellent example of a maternal health condition sitting at this intersection.
The prevalence of anemia in pregnant women is typically lower in higher-income regions, being lowest in North America, and Europe & Central Asia. Rates are particularly high across South Asia and Sub-Saharan Africa; in some countries reaching over 60%.
Globally, around 42% of children have anemia. Below, we see the prevalence of anemia in children under the age of five.
Child rates of anemia are lowest in higher-income regions of North America (9%), Europe & Central Asia (22%), and East Asia & the Pacific (26%). Rates are high across South Asia and Sub-Saharan Africa, with 55% and 60% of children being anemic, respectively.
Vitamin A deficiency
In the map below we see the prevalence of vitamin-A deficiency in pregnant women over the period from 1995 to 2005. Data collection on micronutrient deficiencies are often sporadic and less consistent than indicators of energy-protein malnutrition; time-series data for most countries is therefore unavailable. Note that countries with a gross domestic product (GDP) per capita greater than US$15,000 in 2005 are considered to be free from vitamin-A deficiency as a public health problem and are therefore excluded.
Prevalence rates are typically highest across Africa and Asia. Across North Africa, the Middle East and Central/East Asia, between 20 and 25 percent of pregnant women were vitamin-A deficient. Most countries across Sub-Saharan Africa and South Asia had slightly lower rates between 15 and 20 percent.
By 2005 the prevalence across Central Europe and Latin America was very low, with only a few percent of pregnant women considered to be deficient.
In this second map, we see the prevalence of vitamin-A deficiency in children under the age of 5, over the period from 1995 to 2005.
Prevalence rates are typically highest across Sub-Saharan Africa and South Asia, often reaching up to 60-70 percent. The highest prevalence occurs in Kenya, where almost 85 percent of children suffer from vitamin-A deficiency.
By 2005 the prevalence across Central Europe and Latin America was lower than in Africa and Asia, with rates of deficiency typically between 5-20 percent of children.
Iodine deficiency
Iodine deficiency is the leading cause of preventable brain damage in childhood.
Recognised as a driver in perinatal mortality, a leading cause of mental retardation (iodine deficiency can result in a mean IQ loss of 13.5 points in the population), and thyroid impairments, in the mid-1980s, the world committed to ending global iodine deficiency.6
Iodine deficiency results from dietary intakes low in iodine; this typically occurs within populations with soils low in iodine content (thereby hindering iodine concentrations in crops). Iodine deficiency is therefore hard to address simply through dietary diversification.
The global solution to addressing deficiency has been through Universal Salt Iodization (USI) programmes.
Salt is used as a delivery device for iodine for several reasons: it is widely consumed and has little seasonal variation; salt is typically distributed from a few centralised production centres; it has little impact on taste or texture of foods; and it is inexpensive (USI is estimated to cost US$ 0.02-0.05 per person per year).7
Since the WHO and UNICEF recommended USI to address iodine deficiency, the world has made significant progress. More than 120 countries now have USI programmes, and it’s estimated that 71 percent of households across the world have access to iodized salt.8
Many countries have eliminated iodine deficiency as a public health issue.
Iodine deficiency remains a public health issue in some countries (particularly those of lower incomes). In the map we see the share of households consuming iodized salt from 1993-2013. Overall, we see that many countries (even those of low income) have achieved levels between 60-100 percent. However, access across a handful of countries remains very low–in 2010 for example, less than 10 percent of households in Sudan and Mauritania consumed iodized salt.
Diarrhea treatment, micronutrient deficiency & malnutrition in children
One impact of micronutrient deficiency is its potential to exacerbate existing disease and illnesses.
In 2015, nearly 500,000 children died from diarrheal diseases (the third largest cause of child mortality).
Diarrhea, especially in children, has important links to malnutrition.
Malnutrition can serve to exacerbate the risk of mortality from diarrhea. Additionally, diarrhea affects the ability of children to retain and utilise nutrients properly–this means requirements for nutrient intake are higher for children experiencing diarrhea than under normal circumstances.
Treating diarrheal disease is therefore a nutritional, as well as general health issue. The map shows the share of children under the age of 5 who received diarrheal treatment in the form of oral rehydration salts (ORS packets or pre-packaged ORS fluids).
Oral rehydration therapy (ORT) is the giving of fluid by mouth to prevent and/or correct the dehydration that is a result of diarrhoea. As soon as diarrhoea begins, treatment using home remedies to prevent dehydration must be started. If adults or children have not been given extra drinks, or if in spite of this dehydration does occur, they must be treated with a special drink made with oral rehydration salts (ORS). ORS Oral rehydration therapy (ORT), using a simple, inexpensive, glucose (sugar) and electrolyte (salt) solution promoted by the World Health Organization (WHO) has reduced the number of deaths from dehydration due to diarrhea by about a million per year (Oral Rehydration Therapy, 1994). ORS is a treatment for diarrhea that can be easily made at home, using simple ingredients — clean water, sugar and salt.
How are poverty and malnutrition linked?
Social determinants of undernutrition
The following section adapted from (Roser and Ritchie, 2019 and Ritchie and Roser, 2017) as cited.
Throughout this course we have discussed the strong links between social determinants of health — such as poverty, education and location — and health status. Links between social determinants and malnutrition — including undernutrition, micronutrient deficiencies and overnutrition — are no exception.
Think back to this video clip we watched at the beginning of the course when we first discussed the SDOH generally. How do you see this clip differently, now that you know more about the determinants of health, and from a nutrition perspective in the United States?
Household income as a determinant of chronic malnutrition
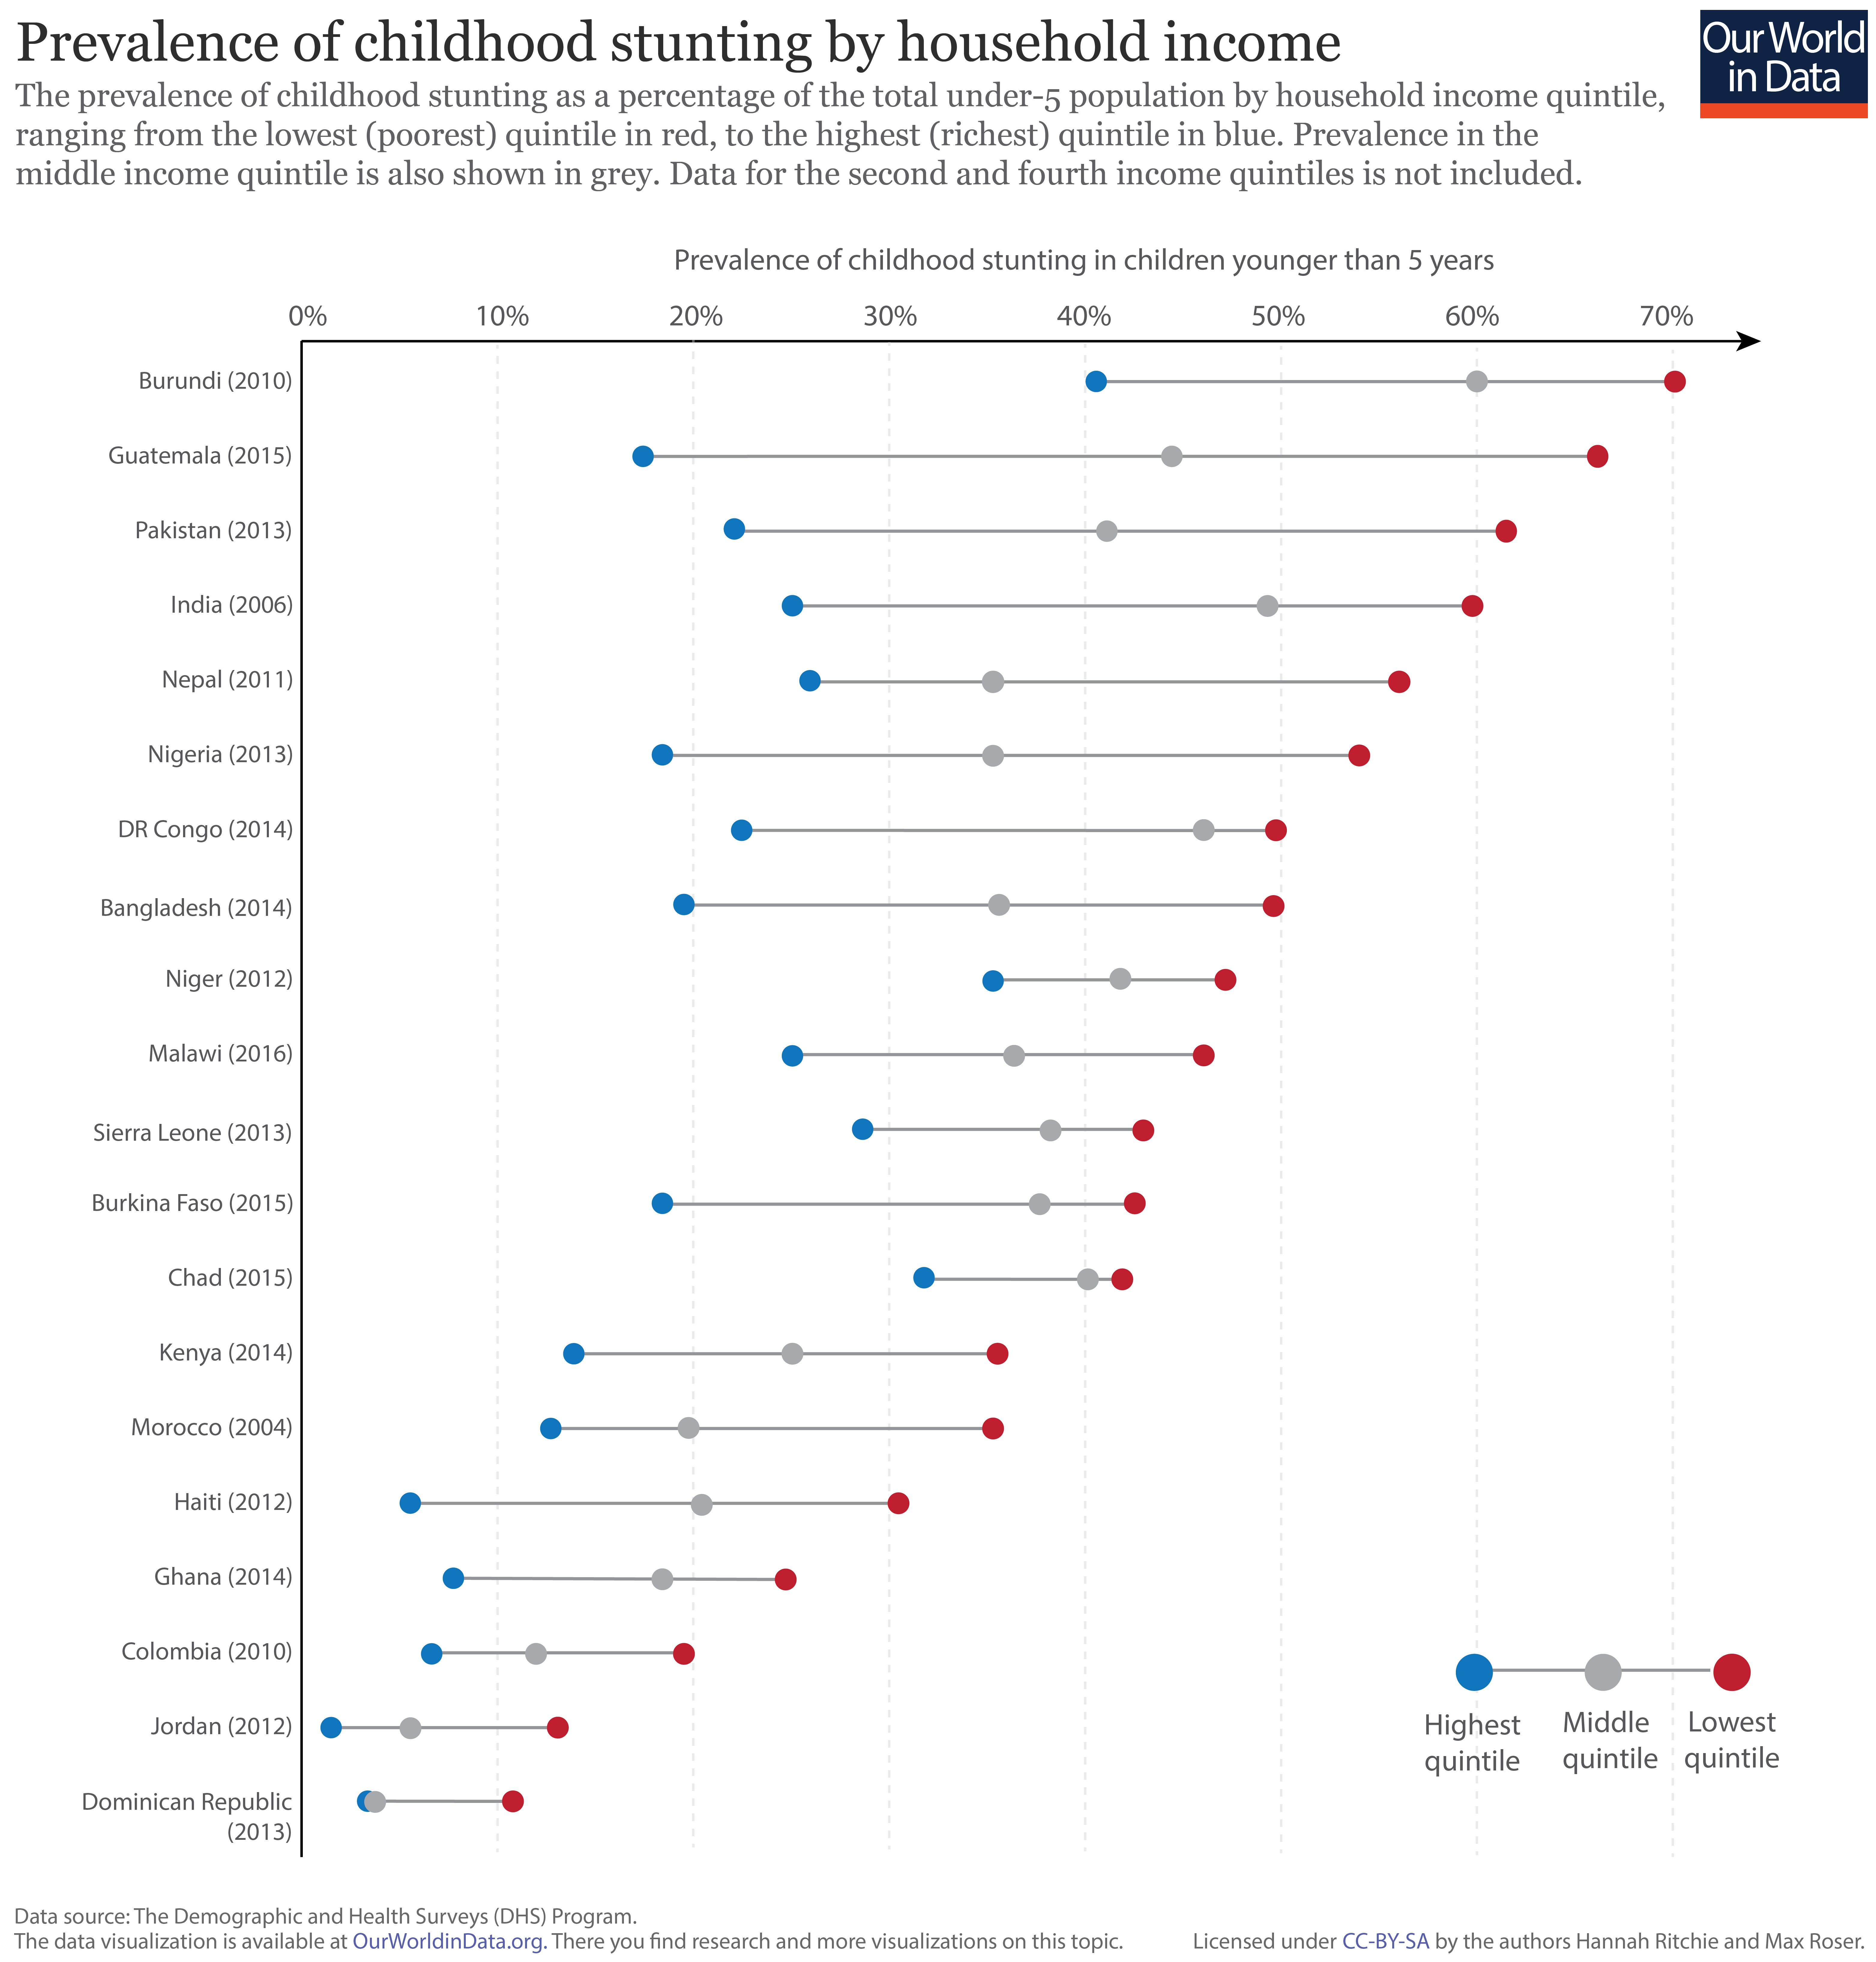
The prevalence of childhood stunting–the key indicator of chronic malnutrition–is strongly related to household income and prosperity. In the figure we have plotted the prevalence of stunting in children under 5 years old, by household income quintile.
Shown in red is the prevalence of stunting within the lowest income quintile in each country; the highest quintile is shown in blue; and the national average in grey.19 This data is based on results of the Demographic and Health Surveys (DHS) program; the date of survey collection for each country is shown in brackets.
As shown, the prevalence of stunting in the poorest households within a given country is typically higher than those with higher incomes. This inequality between rich and poor households varies in magnitude; countries with the highest levels of stunting (i.e. those at the top of the chart) tend to have the largest discrepancy between income levels. This difference in stunting prevalence can reach up to 50 percent in extreme cases.
Education and hunger: women’s schooling matters
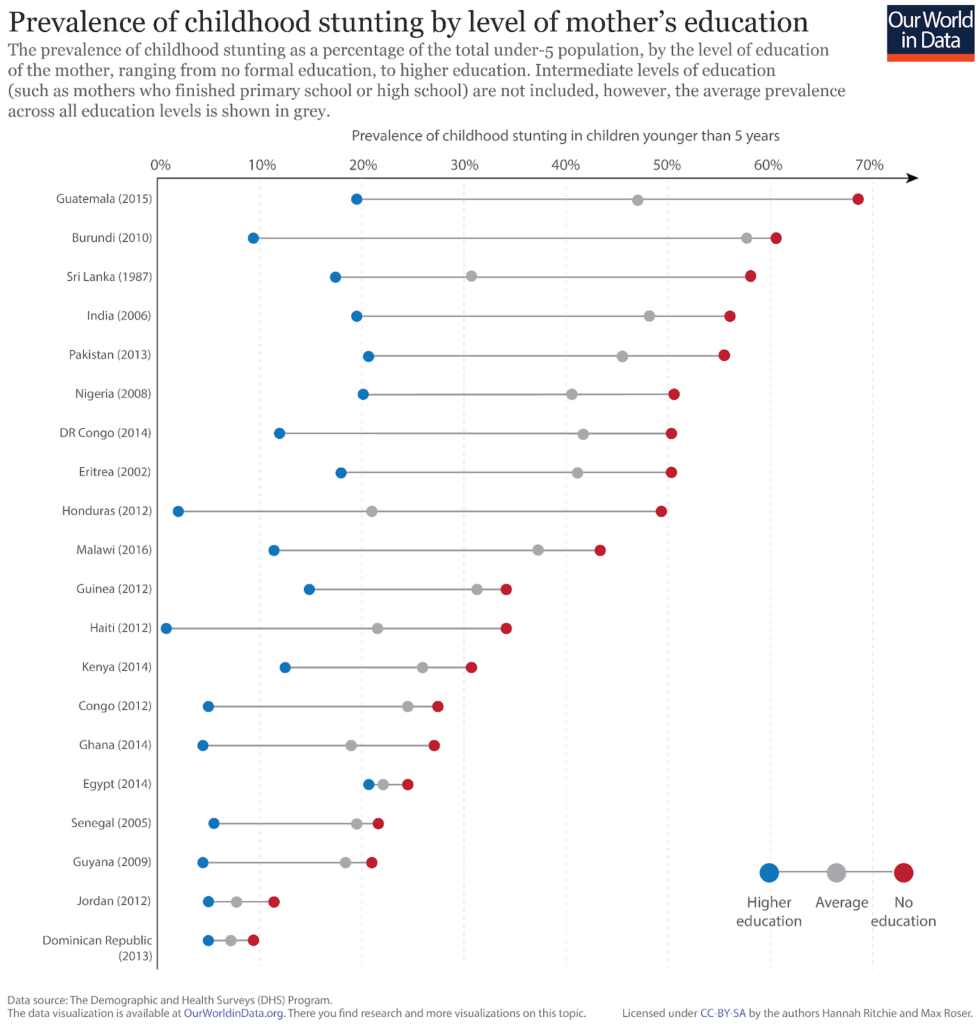
In the context of addressing malnutrition, alongside other key development measures, women’s education is often highlighted as the largest determinant of positive outcomes.20
In the figure we see the prevalence of childhood stunting by the mother’s education level.
Here, we have shown the two extremes: with demographics where the mother has received no formal education in red, and those with higher education in blue. Intermediate levels of education (whereby mothers completed primary and/or high school) are not shown, however, the average across all education levels is shown in grey.
Overall, we see the level of education of the mother is a strong determinant of childhood malnutrition.
Rates of stunting are highest in families where the mother has received no formal education relative to those with higher education–this variability can exceed 50 percent between these two extremes.
We also see that the prevalence of stunting in families with a mother which receives higher education is consistently lower than the average across all educational levels. Continued progress in women’s educational attendance and attainment is therefore a key driver of improvements in childhood nutrition.
Nutrition and location: the rural / urban divide
The residential setting of households can also play an important role in nutritional outcomes.
In the chart we have plotted the prevalence of childhood stunting in rural (shown in red), and urban (shown in blue) settings across a number of developing countries. The national average prevalence of stunting is also shown in grey.
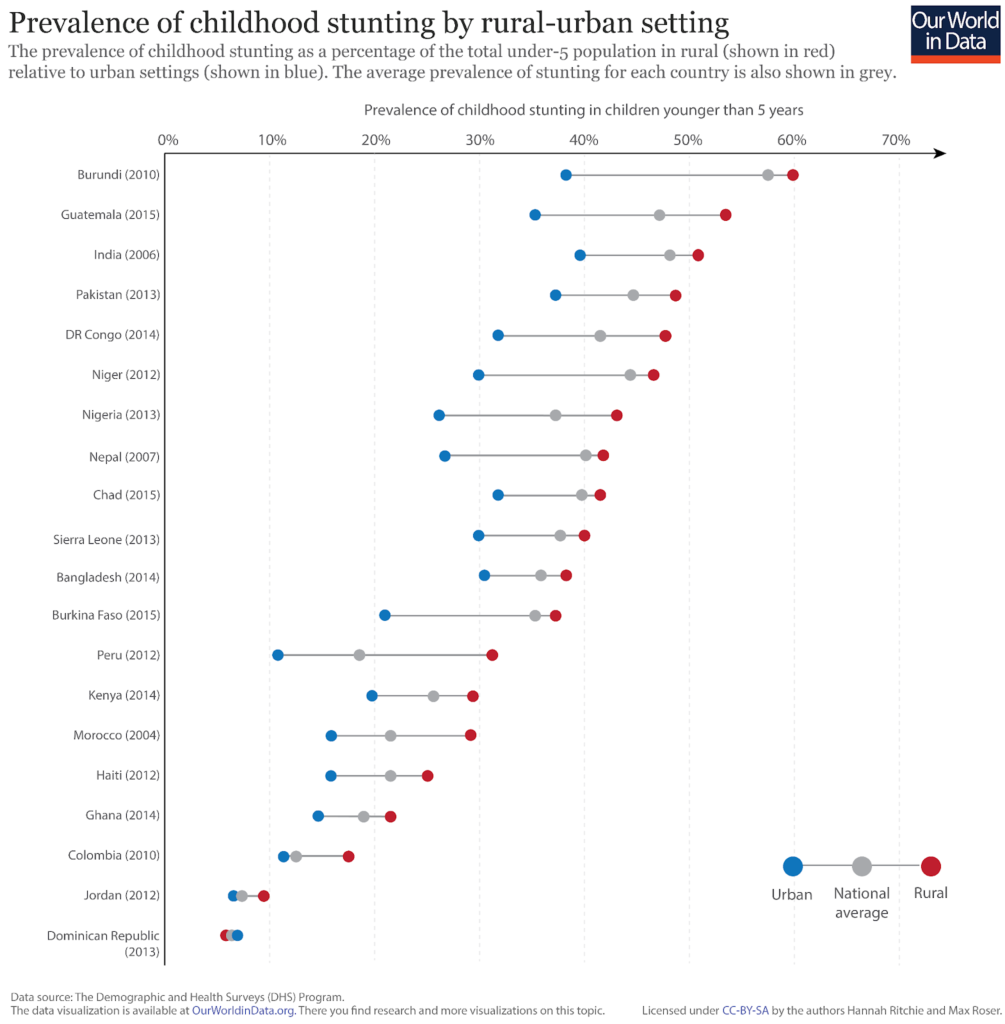
Overall, we see that the incidence of stunting in rural households is consistently higher than in urban settings [the exception to this trend is the Dominican Republic where rates of stunting are approximately the same across household settings]. The strength of residential setting is generally less pronounced as an indicator of stunting prevalence than household income and mother’s education levels; it is nonetheless still significant.
Social determinants of micronutrient deficiency
A reminder, in contrast to macronutrients (energy, protein and fat), micronutrients are vitamins and minerals which are consumed in small quantities, but are nonetheless essential for physical and mental development (Ritchie and Roser, 2017).
To ensure adequate micronutrient intake through dietary intake alone (with the use of fortified, processed foods), a diverse diet is required. Therefore, micronutrient deficiency is more prevalent in countries with poor dietary diversity.
Micronutrient-rich foods include fruit and vegetables, meat and dairy, pulses, seafood, nuts and seeds. In contrast, cereal, root and tuber commodities tend to be energy-dense but micronutrient-poor.
Since there are a range of micronutrient deficiencies and nutritional outcomes we can measure, it is difficult to distill the severity of micro-malnutrition into a single measure. One metric which has been developed to give an indication of the severity of this is the Global Hidden Hunger Index (GHHI). Note, again, that the terms ‘hidden hunger’ and ‘micronutrient deficiency’ are often used interchangeably.
The GHHI is most commonly used to assess the nutritional status of pre-school children (under the age of five).
In the chart we have plotted the hidden hunger index in children (on the y-axis) versus the share of dietary energy attained through the consumption of cereals, roots and tubers. Overall, we see that countries where the average diet is rich in micronutrient-poor cereals tend to have higher levels of micronutrient deficiency (here shown as hidden hunger in children).
We also see that micronutrient deficiency is more severe at lower incomes.
In the chart below we have plotted the Hidden Hunger Index in pre-school children (on the y-axis) versus gross domestic product (GDP) per capita, measured in 2011 international-$ (on the x-axis). Overall, we see that countries with lower GDP per capita experience more severe deficiency and malnutrition issues in children. This is also true of deficiency measures, such as the prevalence of anemia in women of reproductive age.
Why is micronutrient deficiency more prominent at lower incomes? Since cereals tend to be less expensive than other food commodities, poorer households tend to have a more monotonous, energy-dense diet lacking in the dietary diversity required to meet micronutrient requirements.9
Richer households can instead afford to supplement staple food items with a diverse range of micronutrient-rich foods.
Overnourishment and Obesity
(This section adapted from Ritchie and Roser, 2017b unless otherwise cited)
Obesity is most commonly measured using the body mass index (BMI) scale. The World Health Organization define BMI as: “a simple index of weight-for-height that is commonly used to classify underweight, overweight and obesity in adults.1
BMI values are used to define whether an individual is considered to be underweight, healthy, overweight or obese. The WHO defines these categories using the cut-off points: an individual with a BMI between 25.0 and 30.0 is considered to be ‘overweight’; a BMI greater than 30.0 is defined as ‘obese’ (Ritchie and Roser, 2017b).
Obesity is determined by the balance of energy intake and expenditure. Rates have increased globally as [not very healthy] calories have become more readily available.
- Obesity is one of the leading risk factors for premature death. It was linked to 4.7 million deaths globally in 2017.
- 8% of global deaths were attributed to obesity in 2017.
- There are large differences – 10-fold – in death rates from obesity across the world.
- 13% of adults in the world are obese.
- 39% of adults in the world are overweight.
- One-in-five children and adolescents, globally, are overweight.
Obesity: A leading risk factor for early death
In 2016, 13% of adults in the world were obese.
39% of adults were overweight or obese.
Obesity is responsible for 4.7 million premature deaths each year.
Obesity is one of the world’s largest health problems – one that has shifted from being a problem in rich countries, to one that spans all income levels.
The Global Burden of Disease is a major global study on the causes and risk factors for death and disease published in the medical journal The Lancet.3 These estimates of the annual number of deaths attributed to a wide range of risk factors are shown here. This chart is shown for the global total, but can be explored for any country or region using the “change country” toggle.
Obesity – defined as having a high body-mass index – is a risk factor for several of the world’s leading causes of death, including heart disease, stroke, diabetes and various types of cancer.4 Obesity does not directly cause of any of these health impacts but can increase their likelihood of occurring. In the chart we see that it is one of the leading risk factors for death globally.
According to the Global Burden of Disease study 4.7 million people died prematurely in 2017 as a result of obesity. To put this into context: this was close to four times the number that died in road accidents, and close to five times the number that died from HIV/AIDS in 2017.5
Debating BMI and the definition of Obesity
While BMI remains the common measure to determine one aspect of an individual’s nutritional status, used by the WHO and the CDC for example, it is important to note that there are a number of criticisms of using BMI alone as a health and nutrition measure. Mainly, arguments center around the fact that:
- BMI “makes no allowance for the relative proportions of bone, muscle and fat in the body. But bone is denser than muscle and twice as dense as fat, so a person with strong bones, good muscle tone and low fat will have a high BMI. Thus, athletes and fit, health-conscious movie stars who work out a lot tend to find themselves classified as overweight or even obese.”
- “[BMI] suggests that there are distinct categories of underweight, ideal, overweight and obese, with sharp boundaries that hinge on a decimal place…[according to this NPR reporter] that is total nonsense.”
(Devlin, 2009).
Physicians must therefore evaluate BMI results carefully on a individual basis. Despite outlier cases where BMI is an inappropriate indicator of body fat, its use provides a reasonable measure of the risk of weight-related health factors across most individuals across the general population (Ritchie and Roser, 2017b).
Basically, while overnutrition and obesity are scientifically linked to a number of poor health outcomes, many — many — people who have a high BMI and would, according to the formula, be considered overweight or obese, are actually very healthy individuals. Health status must consider a number of factors on the individual level to truly guague health. BMI should not be the absolute definition of good or poor health alone.
So, as you move through this section read global statistics on obesity in the context of this debate over how exactly to measure obesity in Public and Global Health and clinical medicine.
Most importantly for our understanding of overnutrition in the context of Global Health is that cheap, easy, processed calories have become more readily available almost everywhere around the world — but these calories are not quality, healthy calories providing the right balance of macro- and micro-nutrients that individuals — especially children and adolescents — need to develop in healthy ways.
This short [optional] National Public Radio report (4 minutes) Top 10 Reasons Why the BMI is Bogus details these critiques. You can also read the related article here.
The Global Distribution of Health Impacts from Obesity
Globally, 8% of deaths in 2017 were the result of obesity – this represents an increase from 4.5% in 1990.
This share varies significantly across the world. In the map here we see the share of deaths attributed to obesity across countries.
Across many middle-income countries – particularly across Eastern Europe, Central Asia, North Africa, and Latin America – more than 15% of deaths were attributed to obesity in 2017. This most likely results from having a high prevalence of obesity, but poorer overall health and healthcare systems relatively to high-income countries with similarly high levels of obesity.
In most high-income countries this share is in the range of 8 to 10%. This is about half the share of many middle-income countries. The large outliers among rich countries are Japan and South Korea: there only around 5% of premature deaths are attributed to obesity.
Across low-income countries – especially across Sub-Saharan Africa – obesity accounts for less than 5% of deaths.
There is a 10-fold difference in death rates from obesity across the world
Death rates from obesity give us an accurate comparison of differences in its mortality impacts between countries and over time. In contrast to the share of deaths that we studied before, death rates are not influenced by how other causes or risk factors for death are changing.
In the map here we see differences in death rates from obesity across the world. Globally, the death rate from obesity was around 60 per 100,000 in 2017.
The overall picture does in fact match closely with the share of deaths: death rates are high across middle-income countries, especially across Eastern Europe, Central Asia, North Africa and Latin America. Rates there can be close to 200 per 100,000. This is more than ten times greater than rates at the bottom: Japan and South Korea have the lowest rates in the world at 14 and 20 deaths per 100,000, respectively.
When we look at the relationship between death rates and the prevalence of obesity we find a positive one: death rates tend to be higher in countries where more people have obesity. But what we also notice is that for a given prevalence of obesity, death rates can vary by a factor of four. 23% of Russian and Norwegian are obese, yet Russia’s death rate is four times higher. Clearly it’s not only the prevalence of obesity that plays a role but also other factors such as underlying health, other confounding risk factors (such as alcohol, drugs, smoking and other lifestyle factors) and healthcare systems.
Childhood obesity
The World Health Organization reports that the share of children and adolescents aged 5-19 who are overweight or obese has risen from 4% in 1975 to around 18% in 2016.
In the map here we see the share of very young children – aged 2 to 4 years old – who are overweight based on WHO Child Growth Standards. In many countries as many as every third or fourth child is overweight.
What are the drivers of obesity globally?
At a basic level, weight gain – eventually leading to being overweight or obesity – is determined by a balance of energy.9 When we consume more energy – typically measured in kilocalories – than the energy expended to maintain life and carry out daily activites , we gain weight. This is a called an energy surplus. When we consume less energy than we expend, we lose weight – this is an energy deficit.
This means there are two potential drivers of the increase in obesity rates in recent decades: either an increase in kilocalorie intake i.e. we eat more; or we expend less energy in daily life through lower activity levels. Both elements are likely to play a role in the rise in obesity.
To tackle obesity it’s likely that interventions which address both components: energy intake and expenditure are necessary.10
Daily supply of calories
Over the past century – but particularly over the past 50 years – the supply of calories has increased across the world. In the 1960s, the global average supply of calories (that is, the availability of calories for consumers to eat) was 2200kcal per person per day. By 2013 this had increased to 2800kcal.
Across most countries, energy consumption has therefore increased. If this increase was not met with an increase in energy expenditure, weight gain and a rise in obesity rates is the result.
In the chart here we see the relationship between the share of men that are overweight or obese (on the y-axis) versus the daily average supply of kilocalories per person. Overall we see a strong positive relationship: countries with higher rates of overweight tend to have a higher supply of calories.
If you press ‘play’ on the interactive timeline you can see how this has changed for each country over time. Most countries move upwards and to the right: the supply of calories has increased at the same time as obesity rates have increased.
Double and triple burden of disease
(This section adapted from UNICEF, 2019)
Now that we have discussed issues related to malnutrition globally in more depth, when you picture child malnutrition, what do you see?
Twenty years ago, the image was arresting: a dangerously underweight child who wasn’t getting enough to eat.
Today, there are still millions of malnourished children, but the picture is changing.
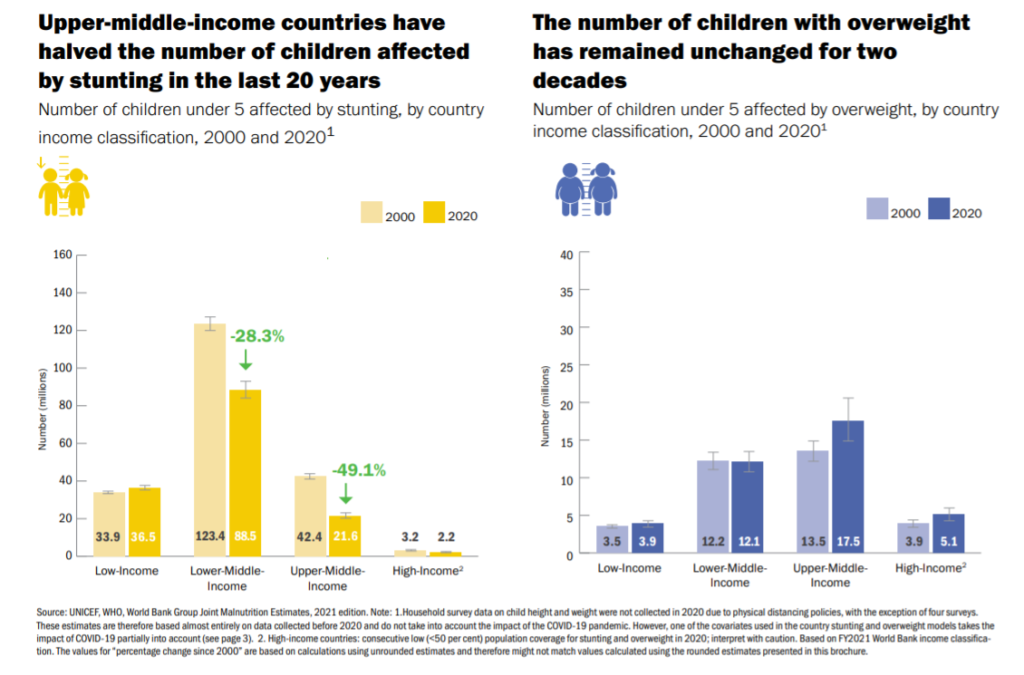
While the number of stunted children is falling in every continent except Africa, overweight and obesity are growing in every continent, including Africa, and at a much faster rate.
Globally, at least half of all children under five suffer from hidden hunger: a lack of essential nutrients that often goes unnoticed until it’s too late.
In many countries, and even within households, these three forms of malnutrition – undernutrition, hidden hunger and overweight – co-exist. This means that a single country may face the challenge of addressing high rates of stunting, micronutrient deficiencies, and obesity. Or a family may have an overweight mother and a stunted child. These trends reflect what is known as the triple burden of malnutrition, a burden that threatens the survival, growth and development of children, economies and societies.
This burden is only expected to grow. Strikingly, not a single country has made progress in decreasing levels of overweight and obesity in the past 20 years.
We are left facing the question: why are so many children eating too little of what they need, while an increasing number of children are eating too much of what they don’t need?
The Nutrition Transition
Over the past several decades, societies have evolved. We are more connected than ever before through global trade markets. More people are moving from rural areas into densely populated cities. More women are thriving in the workforce, while still raising families. And climate change is putting increased pressure on how we live and use natural resources.
Our brave new world has had a profound impact on how food is produced, what food we have access to, and ultimately, what we eat.
Globalization has changed the way we eat. It has rapidly transformed the systems that bring our food from field to families, affecting everything from how food is harvested to how it is displayed in supermarkets. Communities around the world now have access to greater quantities and a wider variety of foods. But with globalization and trade has come an expanded market for junk food and fast foods – as well as extensive food marketing directed at children.
As supermarkets, convenience stores and fast food chains become ubiquitous, families and communities are leaving behind their traditional, often healthier diets, in favour of modern diets often full of processed foods high in saturated fat, sugar and sodium and low in essential nutrients and fibre.
Today, more than half of the world’s population lives in cities. Urbanization has caused a rapid shift in diet and lifestyle, with more ultra-processed foods and less physical activity.
The result is a higher prevalence of overweight and obesity among city dwellers, as well as higher rates of diabetes, hypertension and cardiovascular disease. By 2050, 70 per cent of the world’s adolescents will live in cities, more exposed to the marketing of unhealthy foods and more vulnerable to diet-related diseases than ever before.
More and more women are joining the job market, making up nearly 40 per cent of the world’s formal labour force. Yet, almost everywhere, mothers remain responsible for most child feeding and care. They often receive little support from families, employers or society at large. This leaves too many mothers to face the impossible choice of feeding their children well or earning a steady income.
Extreme weather events like floods, storms, droughts and extreme heat have collectively doubled since 1990, and children are disproportionately affected. They are the most susceptible to waterborne diseases, which increase their risk of malnutrition and death.
Climate shocks disrupt food production and food access for rural families – with drought alone causing 80 per cent of damage and losses in agriculture. In areas where people rely on a single staple crop like maize, a shock to food production can wipe out the entire food supply.
Increasingly, the disruption from climate change is forcing families to abandon their farms and move to urban areas, where processed foods and sedentary lifestyles are commonplace. And because food systems account for almost a third of greenhouse gas emissions, our shift to industrial food production is only exacerbating global warming.
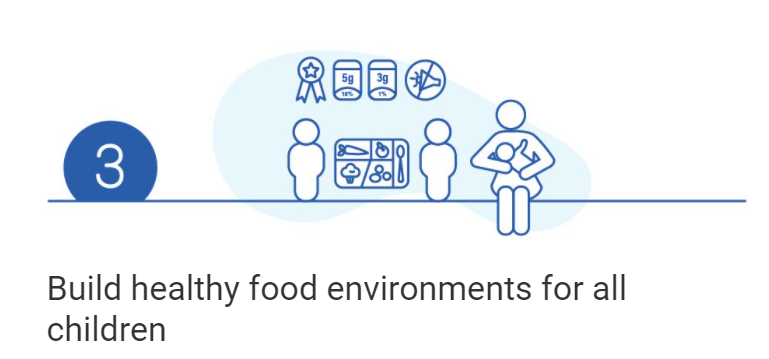
Food environments and marketing
If children aren’t eating the right foods, why can’t parents, or even children themselves, simply choose to prepare and eat healthier foods?
The answer lies in understanding food environments.
When we look at a food environment, in other words all of the factors that influence a family’s food choice – from what is available in their area, to how much money they have, to what foods are convenient or familiar – we see that diets are far from being a matter of simple personal preference.
Families living in cities typically buy their food, so their income often determines what they eat. They are more likely to shop at supermarkets, where much of the food is packaged or ultra-processed. For the urban poor, access to healthy food is even scarcer, and many rely on street food laden with fat and salt.
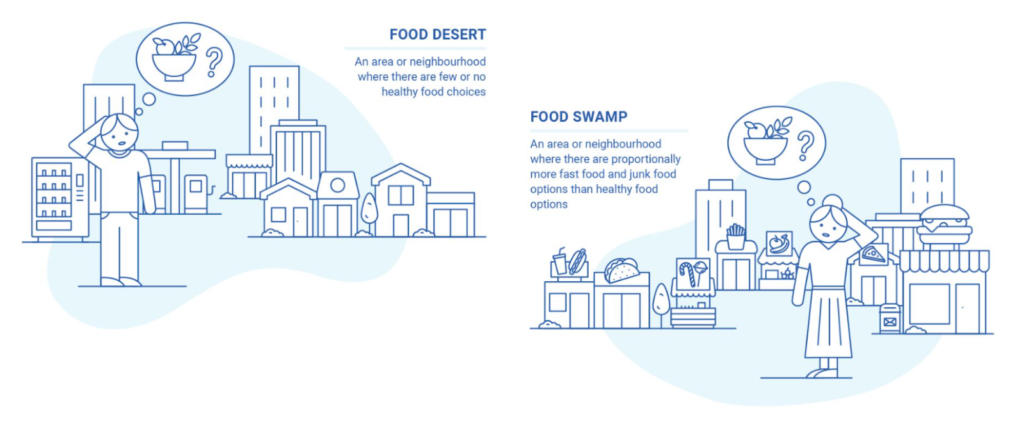
Some families in urban areas live in ‘food deserts’, or neighbourhoods where fresh produce and healthy food markets are nowhere to be found.
Others live in ‘food swamps’, where unhealthy choices like fast food and chain restaurants overwhelm and underprice the number of healthy options.
Time and convenience are also factors. A single parent may struggle to both work and put healthy food on the table. Rural women in particular are often forced to balance unpaid farm work with their role as primary caregivers. As children grow, the main influences on their diet shift gradually from parents and other caregivers in the early years to the staff of day-care centres or other care providers for young children. When children enter school, their peers and friends hold more influence.

One important aspect of the food environment, and a major influence on a child’s diet, is food marketing. Advertisements, food packaging and digital campaigns targeted at children are building demand for junk food, fast food and sugary drinks. This rise in food marketing is directly linked to the increase of childhood obesity.
Children are exposed to a huge volume of marketing for unhealthy foods every day. A recent study conducted across 22 countries found that for every one advertisement for healthy foods, there were four promoting unhealthy foods. This disparity is even greater in high-income countries like the United States and the United Kingdom.
Lower income countries are also seeing a rapid rise in unhealthy food consumption. From 2011 to 2016, fast-food sales grew by 113 per cent in India, 83 per cent in Viet Nam and 64 per cent in Egypt.
In comparison to traditional television and print marketing, digital marketing poses a unique challenge. Globally, one in three internet users is estimated to be a child. With the rise of smartphones, food marketers have a direct channel for advertising that can precisely target children, and is available to them almost all of the time.
Without effective regulation, this constant stream of food marketing – on TV, in print, on digital channels – is impossible for children to escape. Government legislation appears to be the most effective way to reduce unhealthy food sales, and the World Health Organization urges governments to commit to ending childhood obesity by using proven approaches promote better nutrition and to regulate marketing of unhealthy food to children.
Poverty and malnutrition
Most forms of malnutrition across all parts of the world – from rural plots to city blocks – are rooted in poverty and inequity.
Children who live in extreme poverty in low income countries, especially in remote areas, are more likely to be underfed and malnourished. They are least likely to have access to safe water, sanitation and healthcare. Because of their deprivation, they are less likely to finish school, more likely to get sick, and ultimately, more likely to remain in poverty.
Similarly, children born to overweight mothers face barriers to healthy growth. Studies from around the world have shown an association between mothers who are overweight and overweight children in the next generation. Children’s physical and psychosocial functioning in late adulthood has also been linked to overweight mothers. Today, being overweight is the most common risk factor of pregnancy.
But good nutrition can break the vicious cycle of poverty and malnutrition – in just one generation. With proper care and nutrition, children of malnourished parents can still grow to a healthy height. In order for that to happen, women and girls, especially adolescent mothers, need support and guidance on nutrition before pregnancy, both for their own well-being and to make sure their children get the nutrition they need in the crucial first 1,000 days of life.
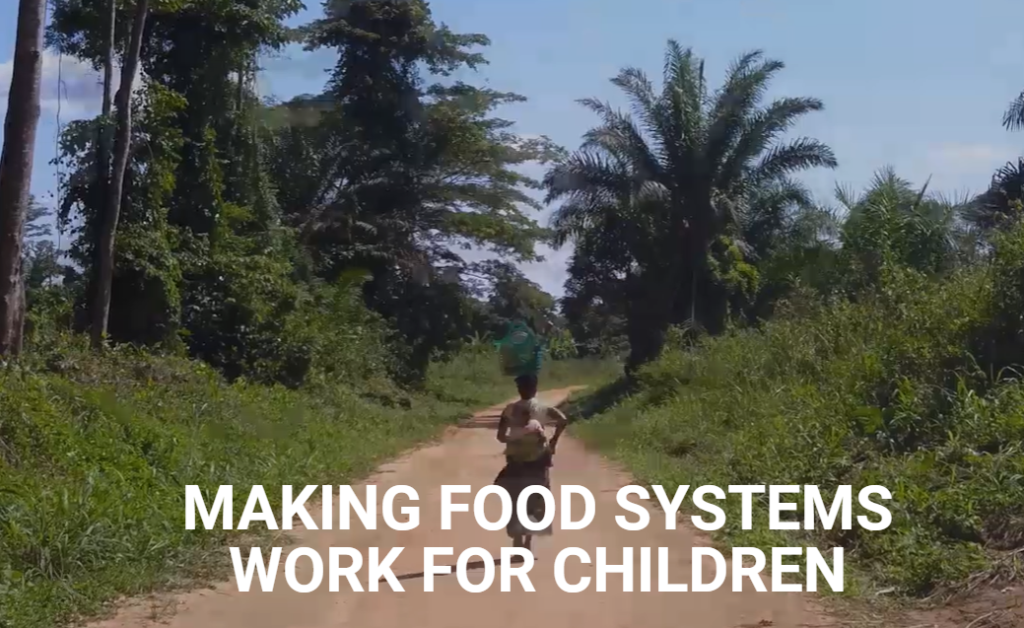
Making Food Systems Work: Solutions to Combat Malnutrition Globally
Good food and nutrition are not only the foundation of children’s health and the development of society at large, they are also a child’s basic human right.
We as communities, parents, governments, food corporations, marketers and global citizens have a collective responsibility to put children’s needs at the heart of our food systems.
This means responding to the challenges we are facing around the world – food deserts, the high cost of healthy foods, time pressures, the limited availability of healthy foods – and the pressure many children, adolescents and families feel from marketing and advertising.
We also need to make food systems work with all other systems that affect children’s lives (health, water and sanitation, education and social protection) to make widespread, long-lasting impact.
The following are actions that UNICEF recommends governments, civil society and the private sector must take to transform our current system from one that aims to simply feed children, into one that nourishes them.

Increasing demand for healthy foods is an important step towards increasing their supply, availability and affordability. But creating this demand requires a cultural shift: one where healthy diets are aspirational, where women have more household decision-making power, and families and children know more about making healthy food choices. This can be shaped through:
- Nutrition education at home, in schools, and through public communication campaigns
- Innovative and memorable communications that appeal to both parents and children (e.g. social media and pop culture)
- Legislation that has been proven to limit demand for unhealthy food, including sugar taxes
- Encouraging fathers and other family members to support women’s roles as both earners and caregivers

Think back to the previous section of reading where we introduced the commercial determinants of health (Dumbaugh et al 2021).
As a reminder, the commercial determinants of health (CDoH)are ‘the strategies and approaches used by the private sector to promote products and choices that are detrimental to health.” (WHO, 2021c)
This is an excellent example of where CDoH can play a huge role in health outcomes in contexts around the world. As you read these proposed solutions from UNICEF, how do you think corporations globally can contribute to healthier children, adolescents and adults and a higher quality of life?
It’s not enough that children and families demand healthy food – it must also be available, affordable, safe and convenient. It should be produced in a way that won’t harm the environment or generate waste. Food producers and suppliers have a key role to play, and governments can set standards and incentives to encourage better practices (UNICEF, 2019).
- Provide economic incentives (e.g. reduced rents and tariffs) to increase production and availability of fruits and vegetables, particularly in low income areas
- Eliminate subsidies for foods high in sugar, refined grains or processed oils, and discourage junk food marketing, especially to young children.
- Invest in modern storage, packaging, processing and other infrastructure to reduce food waste and contamination
- Build more resilient food supplies in areas affected by crisis or climate shocks
- Reduce environmental impact of food production and encourage biodiversity in food systems (UNICEF, 2019)
Children and families shouldn’t have to face barriers to making healthy food choices. In fact, their environments should make it easier for them to eat nutritiously. Local and national governments can take the following steps to encourage families to buy, cook and eat healthier foods:
- Support policies that promote breastfeeding and complementary feeding, including the International Code of Marketing of Breast-milk Substitutes, maternity leave, and breastfeeding-friendly spaces
- Mandate front-of-package food labelling
- Regulate marketing of unhealthy foods to children
- Make school meals healthier, and restrict sales of junk food in and around schools

A child’s nutrition level is influenced by more than just what he eats – it is hugely impacted by whether he has safe water and sanitation, access to healthcare, education, and overall social protection. In order to make widespread, sustainable impact on children’s nutrition, the food system must integrate with these other systems to provide services and support for children who need it most.
- Health: Invest in health workers, pre- and post-natal nutrition education (including breastfeeding), and screening for micronutrient deficiencies and severe malnutrition
- Water and sanitation: Construct safe, convenient latrines and water source points, and encourage hygienic practices like handwashing
- Education: Promote nutrition education in schools and school environments that make it easy for children to eat healthy foods
- Social protection: Providing food vouchers, cash transfers, school meals and emergency food supplies to protect the most vulnerable families

We need accurate, quality data not only to understand the problem of child malnutrition, but also to take informed actions. Yet, data on children’s diets and food systems are remarkably lacking. The following actions will help improve data systems, collection and transparency:
- Setting global and national targets to measure progress on infant feeding, tracking both healthy and unhealthy feeding patterns
- Improving data collection on diets and nutrition for school-age children and adolescents to understand where (societally and geographically) children are eating poorly and why
- Support new tools and innovation for tracking food systems
- Integrate data on nutrition services delivered through related systems (health, WASH, ed., social protection)
References
- Devlin, K. (2009). Top 10 Reasons Why The BMI is Bogus. National Public Radio. https://www.npr.org/templates/story/story.php?storyId=106268439
- National Health Service. (2019). Kwashiorkor. National Health Service. https://www.nhs.uk/conditions/kwashiorkor/
- “Oral Rehydration Therapy.” (1994). The Canadian Journal of Paediatrics. https://rehydrate.org/ors/ort.htm
- Ritchie H and Roser M. (2017). Micronutrient Deficiency. Our World in Data. https://ourworldindata.org/micronutrient-deficiency
- Ritchie H and Roser M. (2017b). Obesity. https://ourworldindata.org/obesity#citation
- Roser M and Ritchie H. (2019). Hunger and Undernourishment. Our World in Data. https://ourworldindata.org/hunger-and-undernourishment#citation
- UNICEF. (2019). The Changing Face of Malnutrition: The State of the World’s Children 2019. https://features.unicef.org/state-of-the-worlds-children-2019-nutrition/
- WHO. (2021a). Nutrition. World Health Organization. https://www.who.int/health-topics/nutrition
- WHO. (2021b). Malnutrition. World Health Organization. https://www.who.int/news-room/fact-sheets/detail/malnutrition
- World Health Organization. (2021c). Retrieved from Who Oral Health Fact Sheet: https://www.who.int/news-room/fact-sheets/detail/oral-health